
Out-of-the-box reports in QuickBooks are a great starting point, but QuickBooks custom reports are the key to creating actionable financial dashboards.
We asked two of our Lucrum CFO Business Advisors, Jason Alexander and Saxby Morehead to identify some of their most frequently created Custom Reports in QuickBooks and give related reporting tips and ideas. Here’s what they had to say.
6 QuickBooks Custom Reports for Strategic Insights
When it came to custom reports our CFOs and accountants created the most frequently in Quickbooks, these were at the top of the list:
-
COGS Detail Report
Used for: Reviewing detailed spending within Cost of Goods Sold (COGS
Gross Profit (Revenue – COGS) is probably the biggest factor in determining the overall profitability and health of a business. Understanding the breakdown of COGS helps in analyzing the direct costs associated with producing or acquiring goods and services. The COGS detail report highlights major cost components, helping businesses understand which factors contribute the most to the cost of producing goods or delivering services.
-
Administrative Expense Detail Report
Used for: Reviewing detailed spending within Administrative costs.
Admin Expense detail reports help verify the accuracy of vendor invoices and payments. It gives the owner a simple way to look at all the overhead expenses incurred or paid during that month. When reviewing this report we often hear “How in the world did we spend X dollars on ____???” By making the business owner aware of the overhead, this can help identify cost-saving opportunities, detect any unauthorized or unusual expenses, and ensure that expenses are being allocated to the correct departments account codes.
-
P&L Report by Customer/Class
Used for: Reviewing Profit & Loss data by customer/class.
A consolidated P&L report is simpler and more efficient for understanding the overall financial health of a business. However, a P&L by customer offers a more nuanced view that is invaluable for customer-centric businesses. It helps in tailoring strategies, allocating resources, and making decisions that maximize profitability and customer satisfaction. It also helps identify any problem customers or point out if COGS were coded incorrectly or perhaps a customer was underbilled (forgotten Change Orders are a common example in the construction industry).
“The basic, pre-populated reports in QuickBooks serve as a foundation. However, the true potential unfolds when these reports are adjusted or used as a base for more in-depth, informative reporting.”
–Saxby Morehead, CFO Business Advisor -
Active Job Report
Used for: Understanding job cost at the time of the report and over/under billing (cash) on the project.
This report can help to identify the actual expenses incurred up to the current point in the project. Especially for larger and longer projects, this report can help the business to stay on track and adjust if expenses are trending too high (vs. estimated expenses) early on in the project.
-
Closed Job Report
Used for: Used to achieve a quick snapshot into closed jobs and trailing costs and warranty expenses that have come in since the job closed.
Just because a job is closed doesn’t mean that every transaction associated with the job has already come through. This report gives businesses visibility into any costs that come in after a job is closed to give the full picture of the cost of a particular job, not just the cost when the job is complete.
-
Gross Margin Analysis Per Job
Used for: Used to understand revenue and cost of closed jobs.
This report tells the business if it is hitting its percentage goals set up for the company. It answers questions like: ‘Did we make money or not on the job? Is our gross margin at what we need or want it to be? If not, then why?’
“QuickBooks Custom Reports equals efficiency. When someone knows how to manipulate QuickBooks, they can get all of the information they need into one reporting view, vs. having to download and reference data across multiple reports.” –Jason Alexander, CFO Business Advisor
Tip: Analyzing COGS can provide insights into the costs associated with different suppliers. This information can be used to negotiate better terms, seek alternative suppliers, or even consider vertical integration.
Tip: For the Active Job Report (and the two Job reports we mention below) each job must be classed or coded correctly. Many companies don’t always do this when starting out and QuickBooks can’t do this step for you. If you need help with classing Jobs or cleaning up data in order to get the reporting views you need, reach out to our Quickbooks experts.
Real-World Application: Customer Profitability Analysis
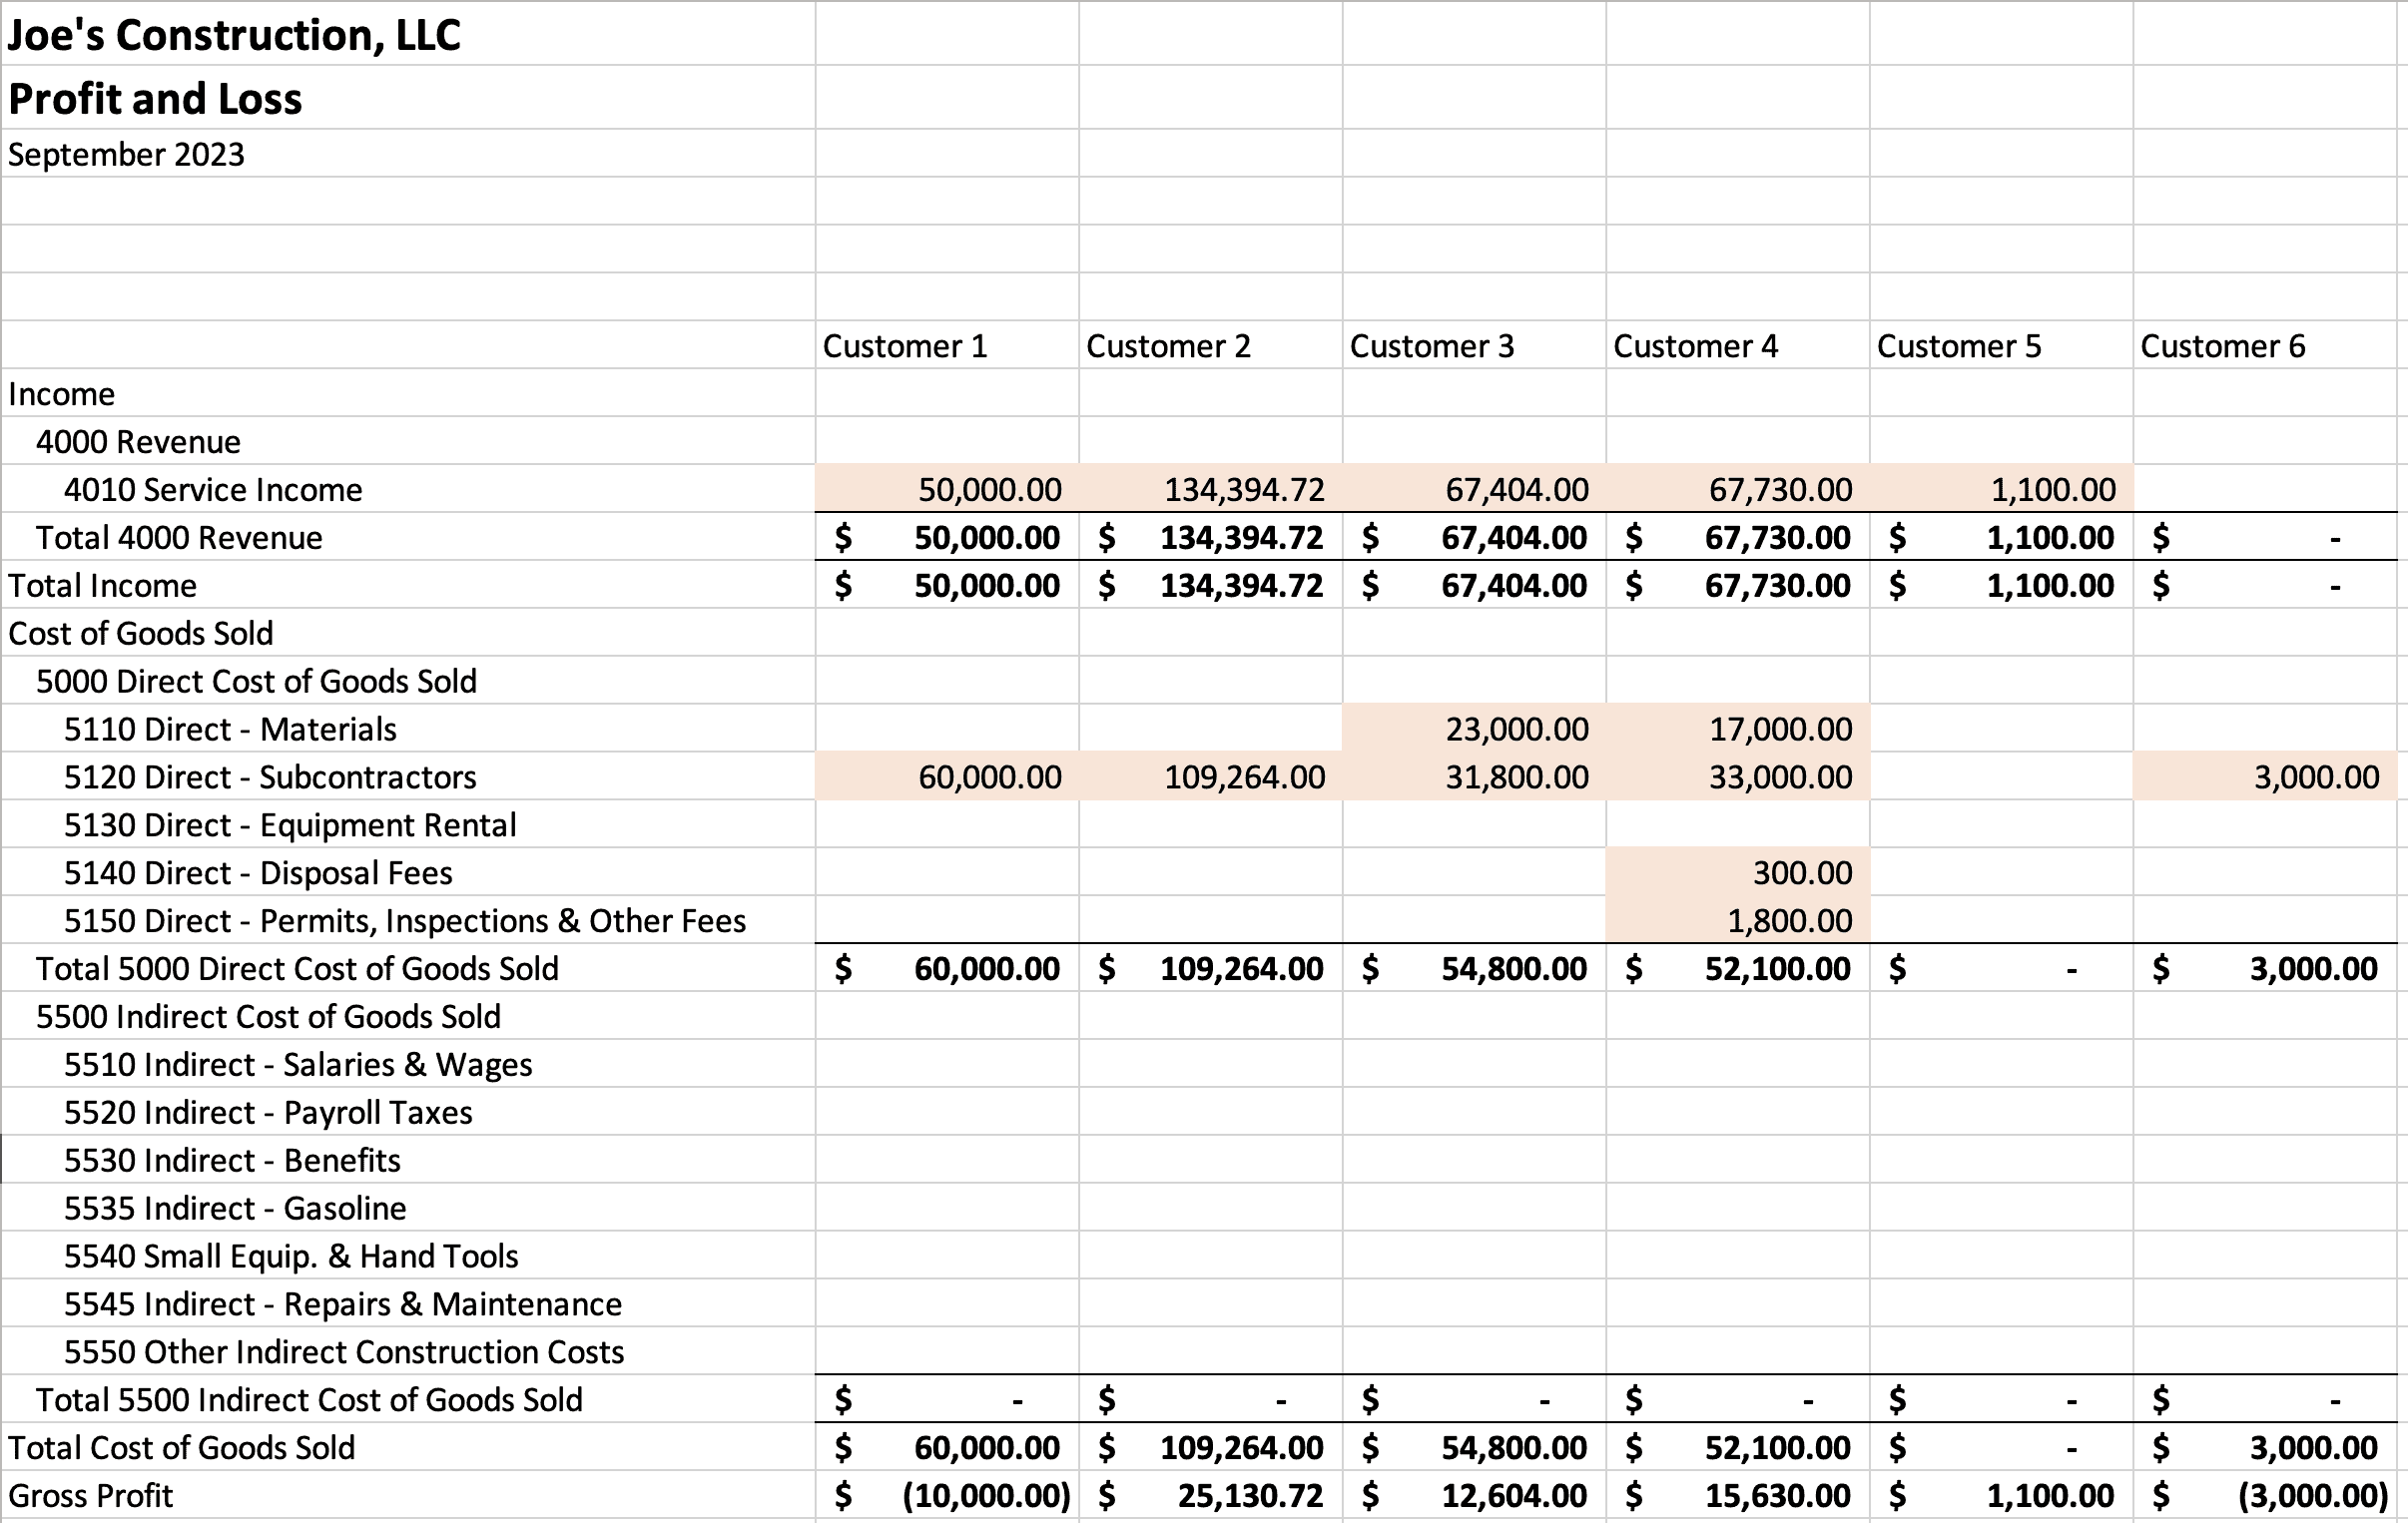
Our CFOs were working with a General Contracting client facing challenges in evaluating the profitability of individual customers. Implementing a job costing strategy and categorizing revenue and costs by customer laid the foundation for the creation of a ‘P&L by Customer’ custom report in QuickBooks.
This report provided detailed insights into customer profitability, empowering the client to make data-driven decisions, optimize pricing strategies, and enhance overall profitability.
QuickBooks Custom Report: Profit & Loss by Customer
Click to expand
Real-World Application: Project Lifetime Cash In / Out
Another one of our CFOs was working with a construction client that was having issues understanding over/under cash for projects. Sometimes they might bill a little ahead (making the project look more profitable than it was) or other times they might have incurred a little more WIP than they billed for (making it look unprofitable). Lucrum built a customized report that gave specific cash in and out for each of their projects — over the lifetime of the project.
Combining Custom Reports via Excel Reporting
Each QuickBooks custom report is on its own useful. But the real magic happens when the data from multiple custom reports is aggregated outside of QuickBooks in an application like Excel – for even more control and customization.
The real magic happens when the data from multiple custom reports is aggregated outside of QuickBooks in an application like Excel – for even more control and customization.
For example, we were working with an exterior remodeling customer that needed a customized Pipeline Report. This report would show the jobs that were in process as well as any others that had been given the “green light” but had not commenced work yet. To achieve the exact view needed, we built 4 different QuickBooks custom reports that would be then referenced in an external Excel report.
Excel relied on the data from the Custom Reports, but the magic happened in Excel on a summary page that pulled data from all 4 Quickbooks Custom reports to get the desired format.
Creating Custom Reports in QuickBooks
To create a custom report in QuickBooks first navigate to the ‘Reports’ tab. From there, select ‘Custom Reports’ and select the report type (eg. Profit and Loss, Sales or Expenses). From here, report parameters such as date ranges, columns, sort order and filters can be adjusted and applied. Once the report is built to the unique business requirements, make sure to save the customization. Another way is to start out with one of the standard Quickbooks reports and modify it, drill down into various accounts and customize it.
Tip: There is some information that QuickBooks will pull into the reports that is not needed to make decisions. Customizing lets you take the unneeded information out and design the report to give only concise information needed for informed decision-making.
Generating and formatting these reports might seem straightforward to an accounting professional, but for others it may not be.
In some cases, the original QuickBooks setup may impact the ability to generate actionable reports and will need to be updated first. To learn more, read our business tips on QuickBooks Dos and Don’ts for Actionable Reporting.
To get the reporting just how the business wants it, it may be worth leveraging the help of an accountant or CFO who specializes in Quickbooks. These professionals support in extracting and formatting strategic financial information for business leadership to take action. They can help both provide guidance in regards to the types of reports that might be most useful for the business to create and in building the reports themselves.
If you’re interested in speaking with an accounting professional about custom reporting needs, contact Lucrum’s Quickbooks experts.

QuickBooks Desktop is Going Away
Should I migrate to QuickBooks Online or Upgrade to Enterpise? Get a customized plan from our experts.
Get Help Now!
- Related Articles -
A Q&A with Jeff Heybruck, CEO, Lucrum Consulting Q: What is Class Tracking In QuickBooks? A: In QuickBooks, “Class Tracking” is a feature that...

By: Jeff Heybruck Retainage, also known as holdback, is a common construction industry practice where a percentage of a project’s payment (usually between 5%...

By: Jeff Heybruck When was the last time you looked under the cushions in QuickBooks? You’re not alone. The majority (over 60%) of QuickBooks...